
An epidemiological study helps figure out health trends in a population. Imagine a community experiencing a higher than usual rate of a certain illness. An epidemiological study would be a large investigation using data points to find out why.
Epidemiological studies are a cornerstone of public health. The information they provide helps us prevent diseases, keep communities healthy, and develop better treatments. Their benefits include:
- Investigating patterns of health and disease: Epidemiologists look at how often diseases occur in different groups of people and why. They consider things like age, location, and even habits to see if there are any connections.
- Finding the root causes: The ultimate goal is to identify what might be causing a disease. This can help with prevention efforts down the line.
- Informing public health decisions: By understanding how diseases spread and who’s most at risk, health officials can make better decisions about things like vaccinations and public health campaigns.
There are different types of epidemiological studies, but some of the most common ones include:
- Cross-sectional studies: These studies take a snapshot of a population at a particular point in time to examine the relationships between factors like exposure and disease.
- Cohort studies: These studies follow groups of people over time, comparing those who have been exposed to a certain factor (like a potential risk factor for a disease) with those who haven’t.
- Case-control studies: These studies compare people who have a disease with those who don’t, to see if there are any differences in their exposures or experiences.
Why might I need to design an epidemiological study as a medical student?
There are a couple of key reasons why you, as a medical student, might be required to design an epidemiological study:
1. Develop foundational research skills: Understanding how to design an epidemiological study equips you with valuable research skills that are transferable throughout your medical career. These skills include:
- Asking good questions: Epidemiology is all about identifying patterns and asking why they exist. Designing a study forces you to think critically about a health issue and formulate clear research questions.
- Understanding research methods: There are different types of epidemiological studies, each with its strengths and weaknesses. Learning to design one exposes you to the different approaches used in medical research and how to choose the most appropriate method for a specific question.
- Data analysis: Even a basic understanding of how data is collected and analyzed in epidemiological studies is crucial. This skill will come in handy later when you critically evaluate existing medical research or even conduct your own studies in the future.
2. Enhance clinical thinking: By delving into the bigger picture of disease patterns in populations, you gain a broader perspective on how diseases manifest and spread. This translates to better clinical practice in a few ways:
- Identifying risk factors in patients: Understanding how social determinants, behaviors, and environmental factors can influence health can help you identify patients at higher risk for certain diseases. This allows for more preventive and targeted care.
- Appreciating disease outbreaks: Epidemiological studies are often at the forefront of identifying and understanding disease outbreaks. By being familiar with these methods, you’ll be better equipped to recognize potential outbreaks and contribute to public health efforts.
- Evaluating medical literature: A strong foundation in epidemiology allows you to critically evaluate the research you encounter throughout your career. You’ll be able to assess the design, data analysis, and conclusions of studies to determine the validity of their findings.
In short, designing an epidemiological study is not just about public health research, it’s about equipping you with the critical thinking and research skills you’ll need to be a well-rounded medical professional.
What will I learn from this guide?
By the end of this guide you will be able to understand the principles of bias, chance and confounding in study designs. You will be able to list study designs and their strengths and weaknesses, and be able to calculate the appropriate measures of association for each study.
The aim of a good study
The majority of the decisions that we make in medical practice are based on evidence from population studies. Information from studies can provide us with:
- risk factors for a disease
- comparative efficacy of treatments
- adversity profile of drugs
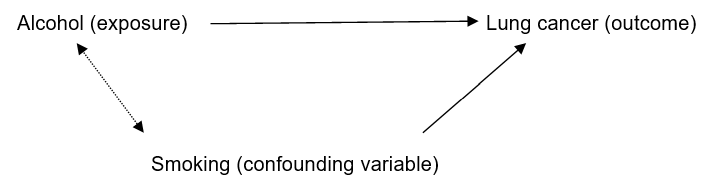
When a study claims to have to show a particular effect, how do we know it’s true? For example, if I claimed that one study showed that drinking alcohol increased the risk of lung cancer how could you assess the validity of this claim?
There are a number of flaws in study design that could mean the claim from my study is not true. Here are a few important considerations:
Could the result have happened by chance?
Is it just luck? To answer this question you should look at the statistics- especially the p values and the confidence intervals of the results. A statistically significant result is usually indicated by the statement p<0.05 or by a 95% confidence interval that does not include the “null value” (null value = 1 for risk ratio or odds ratio and 0 for risk difference). It means that the chance of obtaining such a result by chance is less than 1 in 20 i.e. unlikely to be due to chance.
Could the result be biased?
Bias refers to error. There are many different ways that error can creep into a study. One example is bias with regards to measurement of exposure and outcome. You can imagine that measurement errors could lead to a result that isn’t anywhere near the true value.
Could the result be due to confounding?
Confounding (another type of bias) is a slightly tricky concept. Confounding refers to another variable being responsible for the presumed exposure disease relationship.
The criteria to satisfy confounding are that:
- The confounding variable should be associated with the exposure
- The confounding variable should have a causal role in the outcome independent of the exposure.
- The confounding variable should not occur downstream of the outcome.
Let’s take my hypothetical study where I proposed that consumption of alcohol is related to the development of lung cancer. Smoking, in this case is a good example of a confounding variable. Smoking is known to cause lung cancer. Smoking is also associated with alcohol consumption. Therefore the presumed effect of alcohol on lung cancer may be due to smoking.
The different types of studies
Now that we’ve considered some of the challenges in study design, let’s go on to look at the different types of studies.
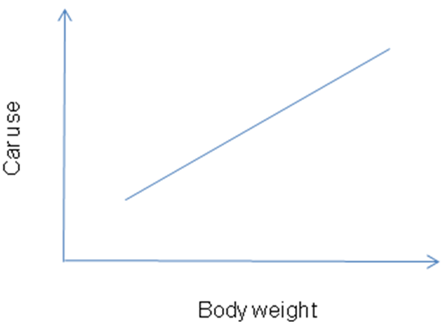
Cross sectional study
Description: Measures the prevalence of exposure and disease in individuals at one period in time
Measures: Scatter graph, correlation coefficient.
Example: A survey of patient’s body weight and car use showed that body weight was positively associated with car use
Advantages: Quick, convenient. Good for formulating hypotheses.
Disadvantages Cannot establish temporal relationship between variables e.g. chicken and egg scenario – what causes what?
May not always account for confounding variables.
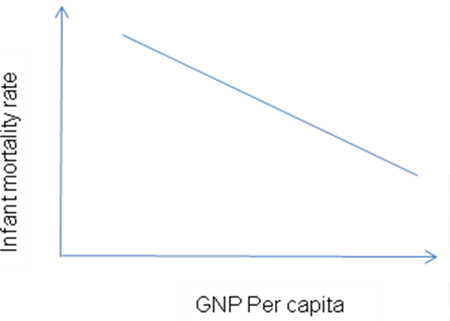
Ecologic study
Description: Measures exposure and disease outcomes at a population level at one period in time
Measures: Scatter graph, correlation coefficient
Example: The negative relationship between gross national product per capita and infant mortality rate across countries.
Advantages: Quick and convenient to do. Good for formulating hypotheses.
Disadvantages: Similar to cross sectional study. In addition, be aware of the ecologic fallacy– relationships between variables that are true on population level cannot be assumed to be true on an individual level.
(Prospective ) Cohort study
Description: Subjects should be without the disease at the beginning. The study follows those who have been exposed to a particular variable and those that haven’t (NB you don’t’ have control over the exposure unlike a randomised controlled trial )
At the end of the study period, measure the incidence of disease in the two groups and compare them
Example: Smoking and incidence of myocardial infarction (MI)
| MI | No MI | Total | |
| Smoker | 20 | 180 | 200 |
| Non smoker | 5 | 95 | 100 |
Measure: Risk Ratio or Risk difference
Risk Ratio = Incidence in exposed/Incidence in unexposed
= (20/200) / (5/100)
= 2
Those who smoke, have twice the risk of developing an MI compared to those who don’t smoke
Risk difference= Incidence in exposed – incidence in unexposed
= (20/200) – (5/100)
= 5 per 100
There is an excess risk of MI of 5% in the smokers compared to those who don’t smoke.
Advantages: Good study for examining temporal relationship between exposure and outcome.
Can adjust for most confounding variables if they are accounted for in the study design.
Disadvantages: Require long follow up period, and not so good for rare outcomes.
Case-control study
Description: Diseased and non diseased individual are identified. Exposure is retrospectively ascertained for all individuals. Look at the odds of exposure in each of the diseased and non diseased groups.
Example: Investigating whether a childhood disease x is due to an exposure to a drug in utero
| Childhood disease x (cases) | Non diseased (controls) | |
| Drug in utero | 100 | 10 |
| No exposure | 50 | 50 |
Measure: Odds ratio
Odds ratio = Odds of exposure in diseased group/ odds of exposure in non diseased
= (100/50) / (10/50)
=10
The odds of someone developing disease x after exposure to drug in utero is 10 times more than if they had not been exposed.
Advantages: A good study design to use for rare outcomes (e.g. cancer)
Disadvantages: You are unable to tell the absolute risk of a disease in an exposed or unexposed group. You can only make a comparative statement such as the odds ratio.
Prone to recall bias (e.g. diseased subjects may recall exposure more favourably then non diseased subjects).
Randomized Controlled trial
Description: Participants randomized to two groups- exposed and non exposed (note that exposure is assigned in this study unlike the cohort study). Measure disease in the two groups during the study or at the end of the study and compare.
Double blind– refers to the fact that both the researcher and participant are blind to the treatment that they are getting.
Intention to treat analysis – refers to the fact that data of individuals are analyzed on the assumption that they stayed in their respective exposure groups (e.g. drug or placebo).
Example: Trial comparing drug A versus placebo in prevention of colorectal cancer.
Measures: Risk difference or risk ratio
(see calculation for prospective cohort study)
Advantages: The Gold standard of study designs. Randomization minimizes confounding.
Disadvantages: Ethical limitations- very difficult to randomize in circumstances where you know there will be harm done to the control group. Also difficult to do randomised controlled trials for invasive procedures.